
Temperaturkollen
Compare this year's temperature with any earlier year and the 1991–2020 normal, day by day, for 811 Swedish places – built on SMHI's measured data.
Opens at bsite.se/app/temperaturkollen/

Maturity
- Idea(completed)
- Prototype(completed)
- Alpha(completed)
- Beta(current stage)
- Promoted
About the project
Temperaturkollen answers one question well: how warm has it been where you live – compared with another year and with what is normal? Pick a place, and the chart puts this year, an earlier year of your choice and the 1991–2020 normal on the same calendar, day by day.
The numbers are SMHI’s own measurements, with the rules spelled out on the page: daily means are averaged, never summed; a month needs nine days in ten to count as complete; a comparison always covers the same days in both years. Where data is missing, the line breaks instead of guessing.
Behind it is a small Next.js app with a SQLite file, an import process that follows SMHI’s archive and hourly feed, and around 150 unit tests plus browser tests for the statistics.
Current state
What works
- An interactive chart comparing two years and the 1991–2020 normal on matching calendar dates, with daily, 7-day and monthly means
- Fair comparisons – both years are cut at the last measured day, gaps stay gaps and 29 February never shifts the rest of the year
- Deviation from normal per month, warmest and coldest days, a month table and the full measured history per place
- A live map and rankings from SMHI's hourly observations, with stale values marked rather than shown as current
- 945 stations and 30 million daily values back to the 1800s, updated automatically from SMHI
- English and Swedish, shareable views in the address bar, keyboard and screen-reader support
What isn’t finished
- Not yet tried by real visitors – the questions people actually ask are still a guess
- No own domain yet; temperaturkollen.se is taken
- Forecasts are deliberately left out, and there is no per-hour view of the current day
Why is this project on BSite?
- Early prototype
Temperaturkollen is a sister to Nederbördskollen and was built in two days. The statistics are tested hard, but nobody outside the build has used it yet. It lives here while that happens; if the place pages find their readers it moves to its own domain or to EverydayApps.
Screenshots
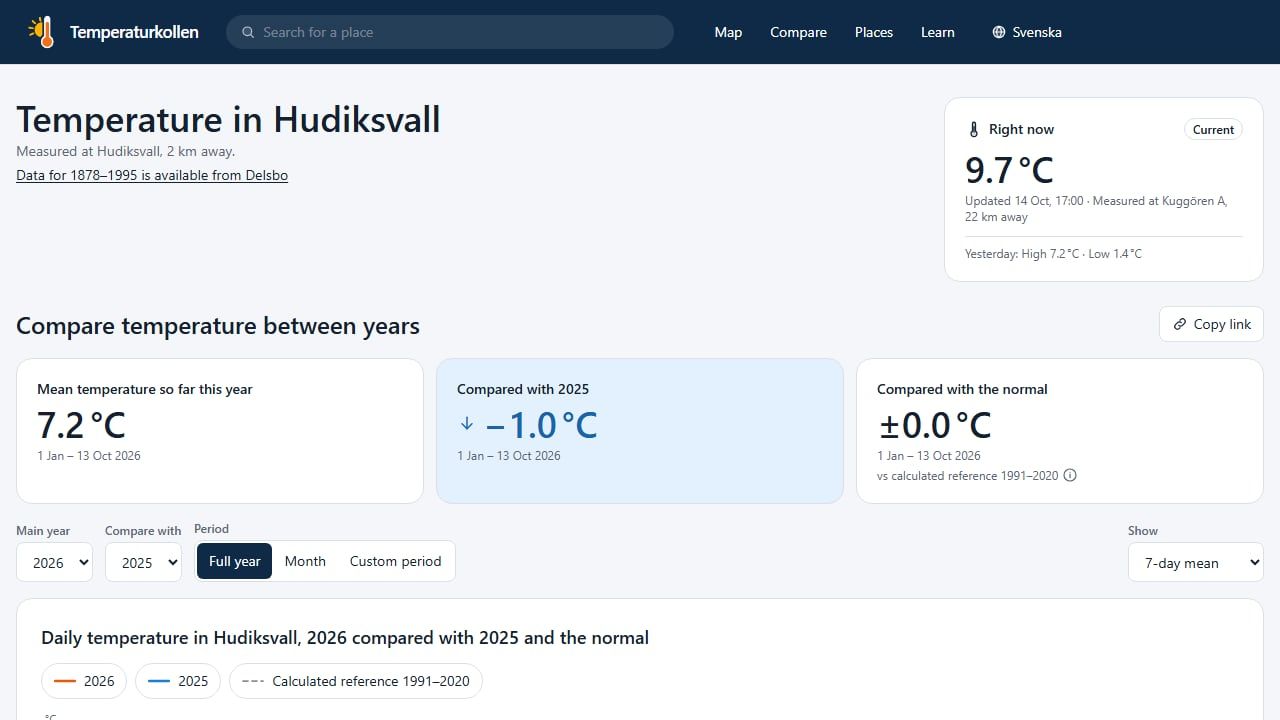
The place page for Hudiksvall with the current temperature, three summary cards and a line chart comparing 2026 with 2025 and the 1991–2020 normal. 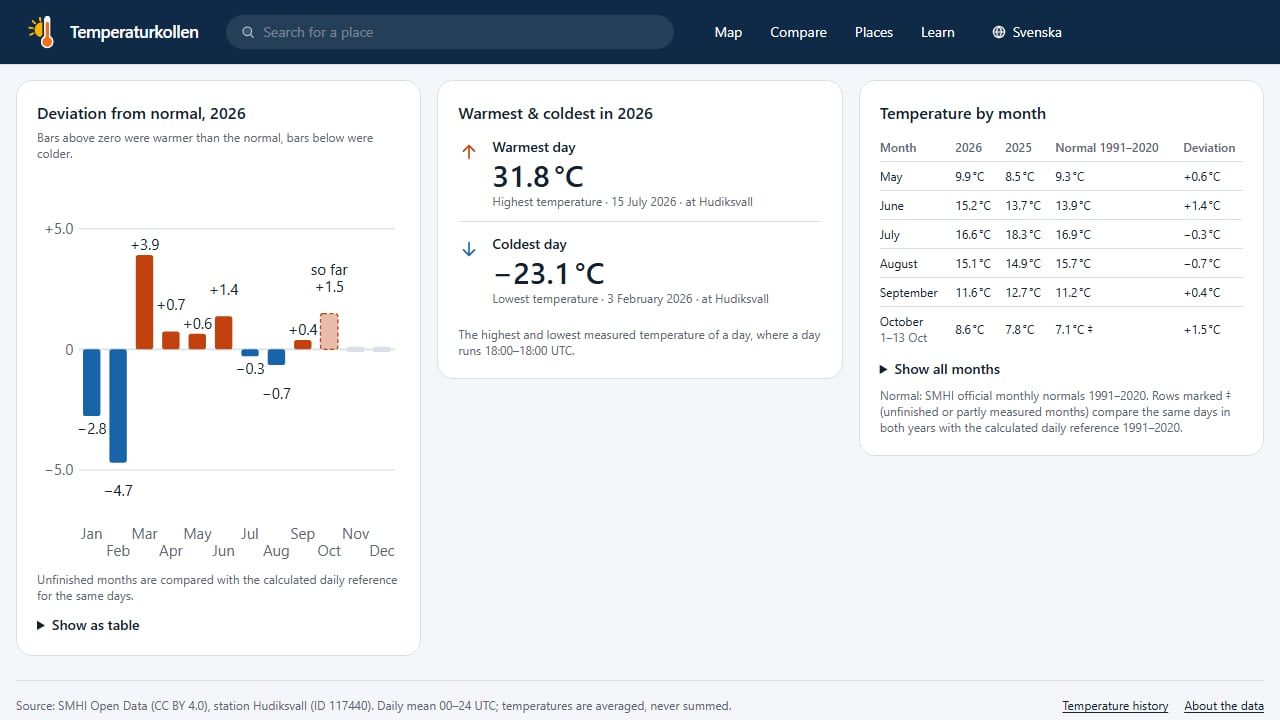
Deviation from normal per month as bars, the warmest and coldest days of the year, and a month-by-month table for Hudiksvall. 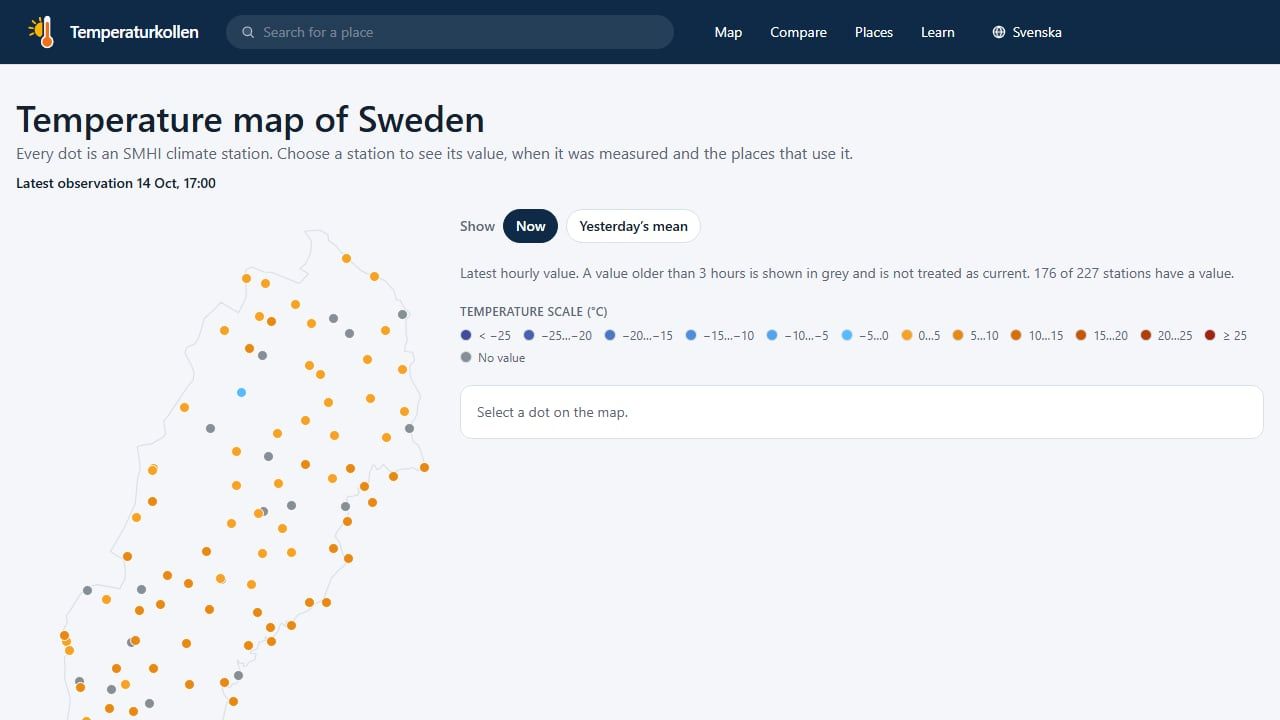
A map of Sweden with weather stations coloured by their latest hourly temperature, from blue in the north to orange in the south.
Development log
Place pages, map, rankings, history and knowledge articles finished and published in the lab at bsite.se/app/temperaturkollen/.
Design spec, a 20-task plan and the full SMHI import (945 stations) done; the comparison chart built and reviewed.